
20 min reading time; ~4300 words
The fun of owning rural property is that knowing where your land actually starts and ends is a guess usually. Sure, you have a parcel description, and maybe even an online service with “official” GIS boundaries (for us here in New Brunswick, this is GeoNB). However, since it’s in the middle of the forest, the odds of you having an actual surveyed and monumented boundary line are very low. Which also means the odds of the online boundaries being correct isn’t great either. This post is a dump of all the experiences I’ve had over the past 3 months, on my quest for accurate mapping.
I purchased a lot like this recently, and since I want to build an event space on it, knowing where it actually is became very important. My first pass at figuring this out was to install Map Plus on my iPhone 14 Pro, and then create shapes for my and my neighbors lots from corner coordinates copied from GeoNB. This iPhone has a dual frequency GPS (L1 + L5), which should get me to roughly 30 cm (11.8″) accuracy. In real-world testing, I’ve gotten at best 3.5 m (11.5′) accuracy, but mostly 4.5 m (14.75′), which is good enough to eyeball things, but not enough certainty to be confident that something is where you think it is.
Using this combination, I was able to start feeling out my boundaries, and open a dialog with my neighbor about the fact that he wasn’t in fact in the middle of his property with his camper, but more likely at or over the edge (which he was not happy about, since he wanted to be in the middle). I had been planning to get a survey of that side of my property anyway, because I wanted to know for sure where it was, but this starter tool was great for at least opening the conversation while I waited for my surveyor to get back to me.
Map Plus
Once I had installed this app on my phone, and got some basic boundary shapes plugged into it, I spent a few weekends wandering over my land, to get a feel for what I had purchased. Map Plus proved to be very useful for my initial survey, and I’ve purchased about half of the functionality they sell with it.
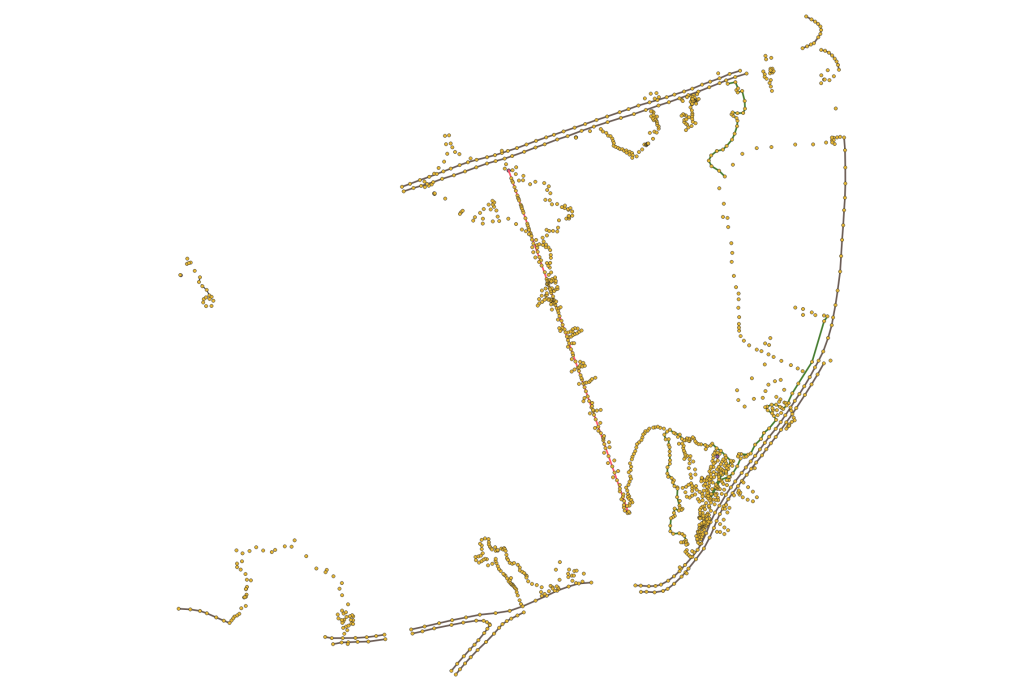
The screenshot to the right shows the results of the data I collected (close to 400 data points). Of all the tools I’ve worked with so far, this one is the easiest in terms of usability. While obviously aimed more at the casual market (with no ability to use external GPS sources), it still has a lot of useful functionality, such as the ability to handle shapefiles and other GIS formats. In that image, you can see the results of some of the work I did, where I collected data in the app, exported it, generated a shapefile (via QGIS), and imported it back in as a cleaner map element.
If you aren’t looking for that higher accuracy GPS, Map Plus is a great app. The ability to even do things like upload / download data via a built in web server is by far the smoothest workflow I’ve found to get data in and out. Honestly, if this app supported Bluetooth GPS and NTRIP, I’d still be using it as my only app.
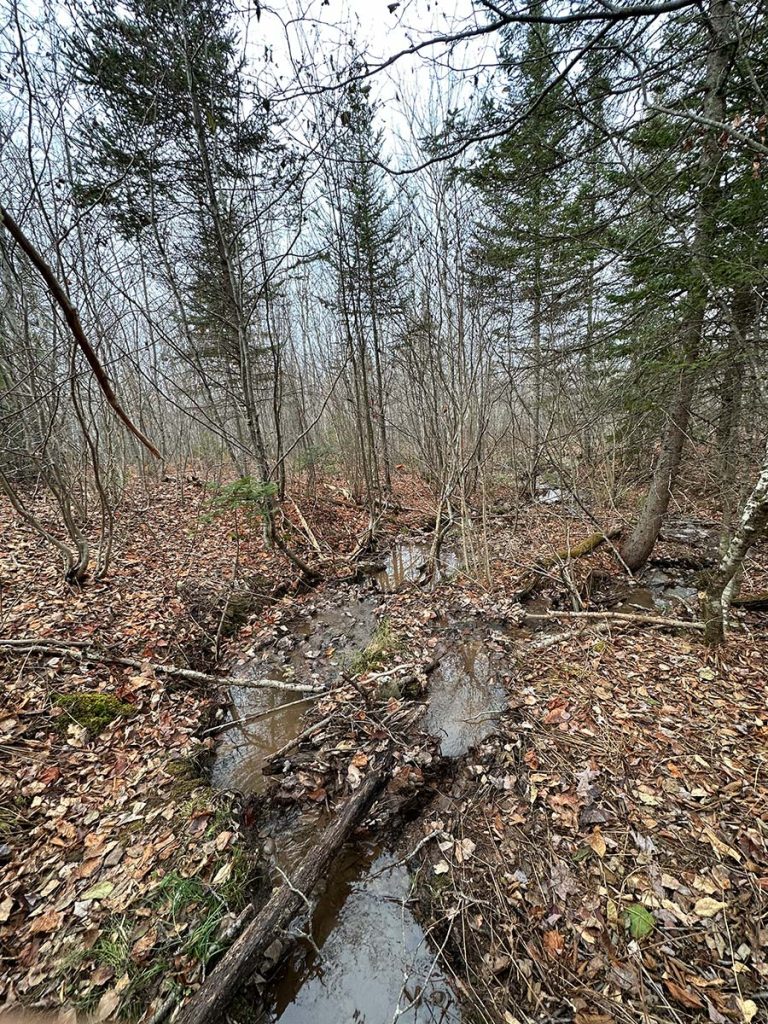
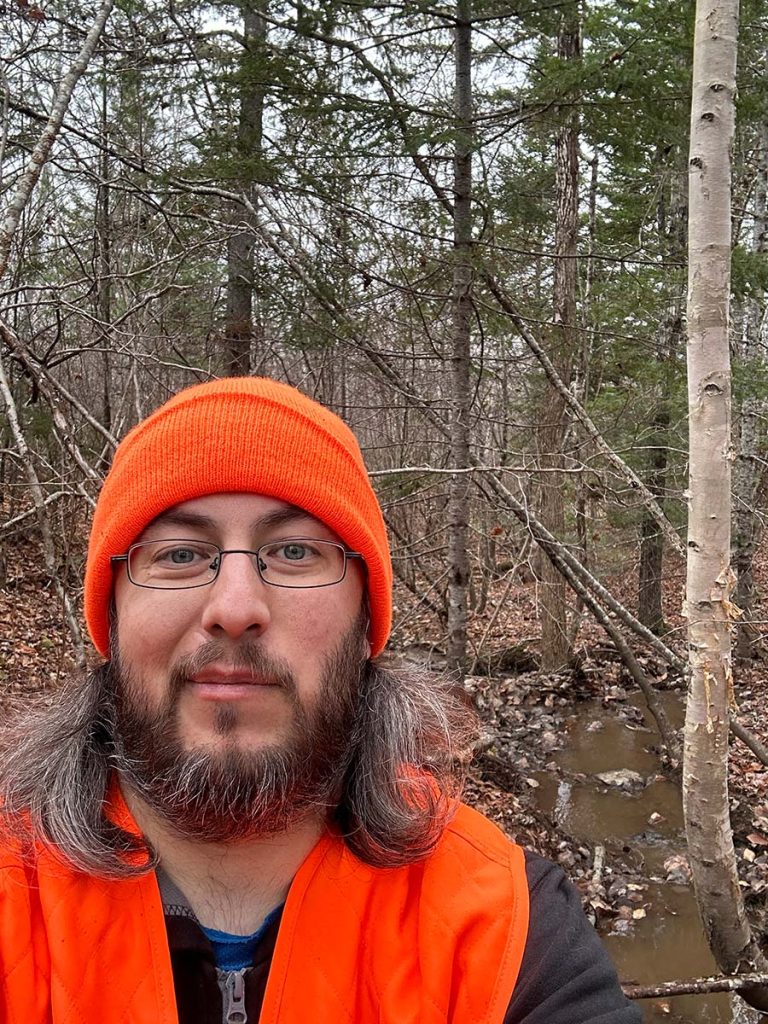
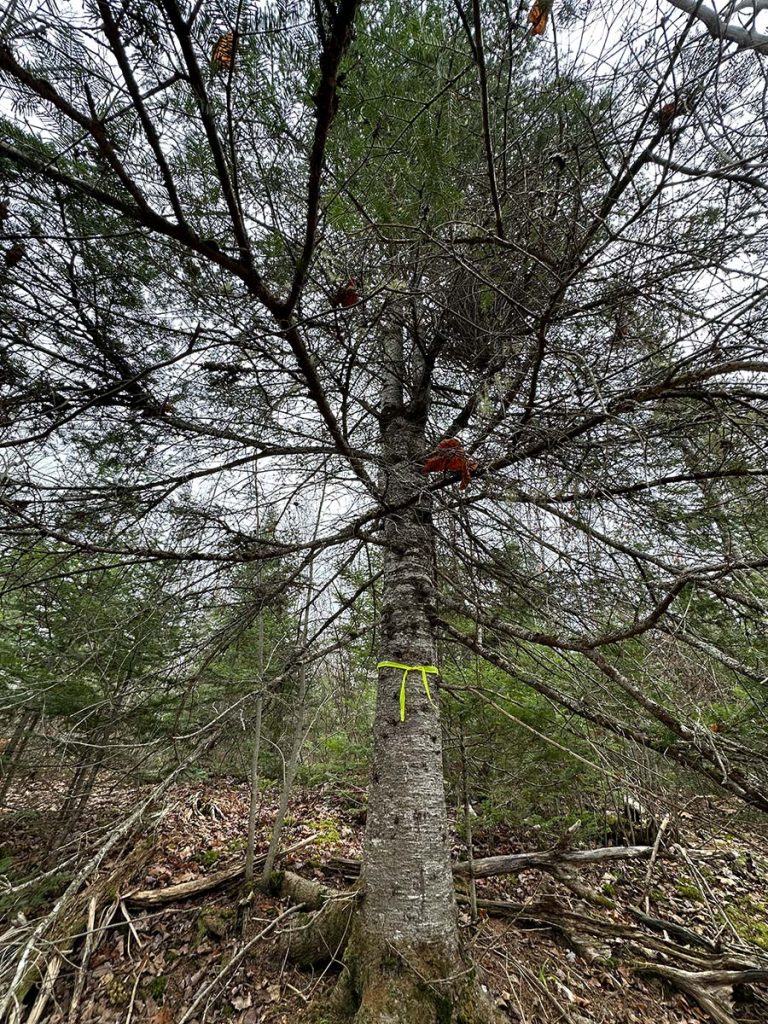
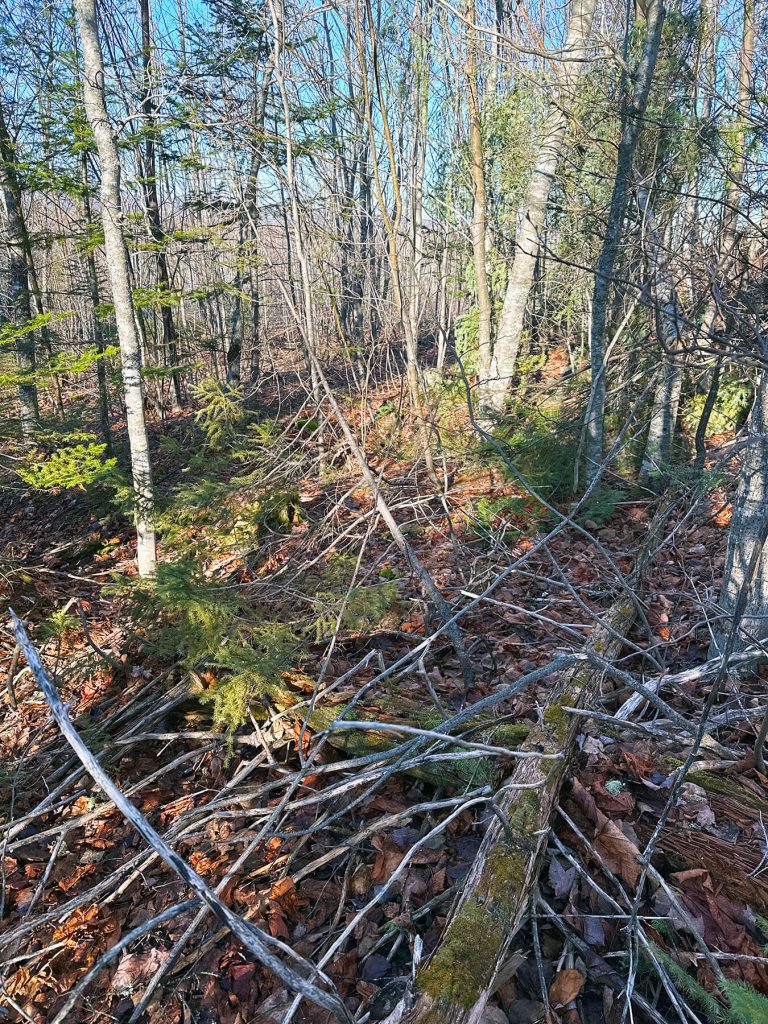
While I waited for my survey, I continued to research and learn things. And, of course, get out to my land every chance I could to walk it. Fall, with the leaves out, then not, has been a very interesting time. I’ve spotted some small frogs, a rabbit, and a few birds (including one that burst from it’s hiding spot very close to me and almost gave me a heart attack 😂). As you can see in one of these photos, I’m wearing the delightful “don’t hunt me, I’m a person” blaze orange hat and vest that you need when you’re wandering though the woods during hunting season.
An Official Survey
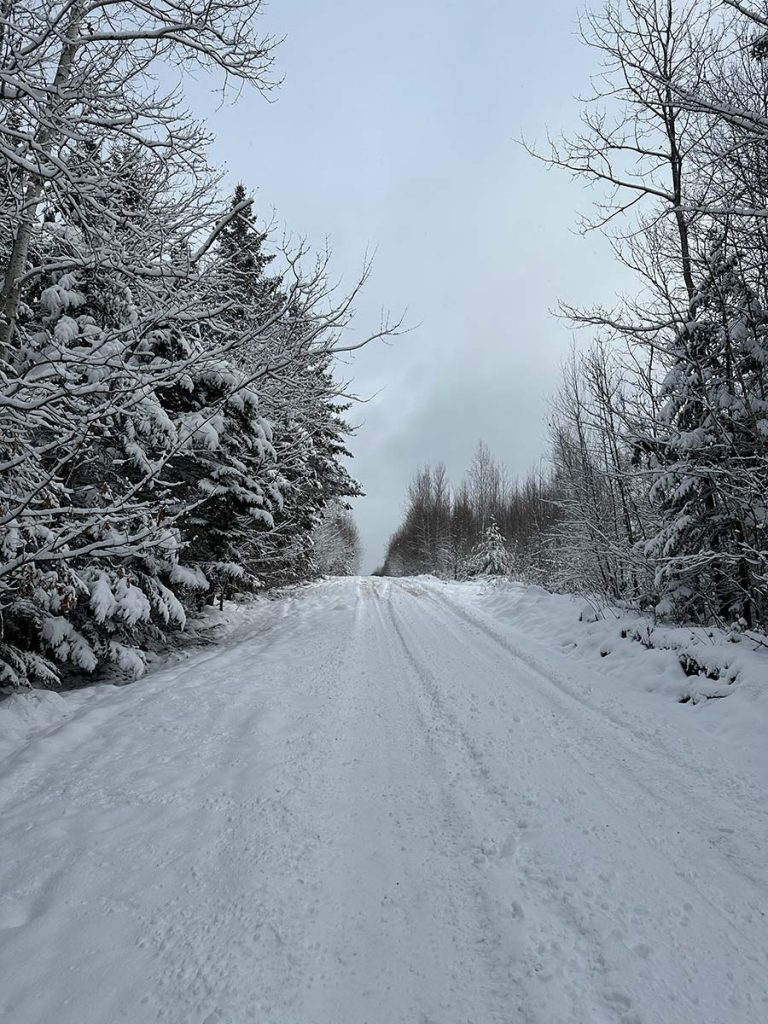
Finally, my survey arrived. On a snowy Tuesday, I drove to the bottom of the mountain, hiked in 3 km (1.9 mi) to my land, and met the surveyor crew. (Normally, I would have driven straight up, but a sedan on a mostly unplowed road, with 10 cm (3.9″) of snow, and no snow tires on yet is a recipe for needing to call a tow truck.) Over the course of the next three hours, myself and the surveyor hacked through the snowy trees, blazing and marking the official survey boundary. At the end of that process, sweaty and somehow also cold, I finally had two official pins and a single line in the woods, that definitively said “this is in fact my land”.
Given the cost of that line (roughly $4600), I opted to only have the boundary between me and my neighbor defined. The land to my east and behind is all owned by an excavation company, but they’re only operating in the far south west corner of it, so there’s no need yet to have the rest of my boundaries marked, now that I have one official line to pin everything to.
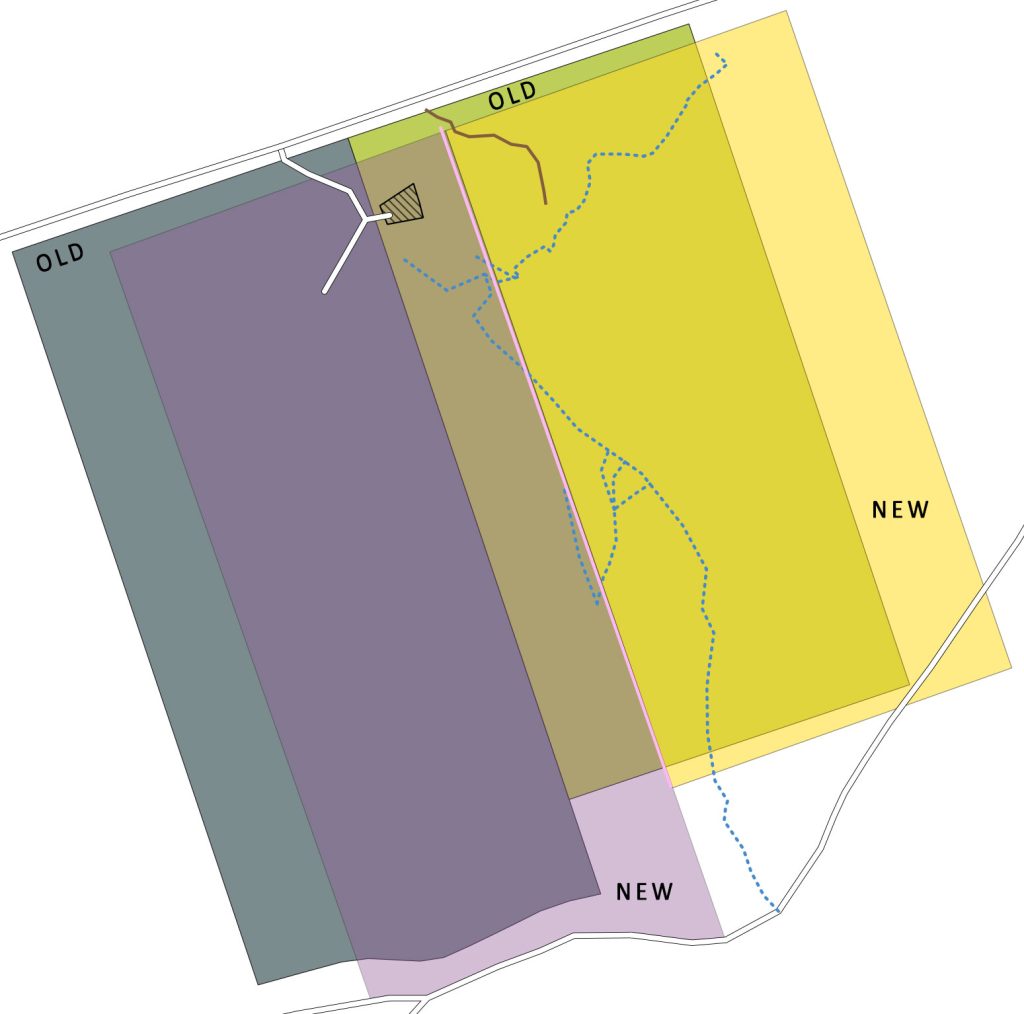
Once I got the official boundary coordinates from my surveyor, I created a new line in QGIS, and rotated and aligned my and my neighbor’s lot shapes to the new boundary. Turns out, the survey was off a lot more than any of us expected, and moved everyone a hefty 39 m (127′) east, and 8.5 m (28′) back from the road, approximately.

But More Accuracy Though
So, coming back to my own survey work now that I had my official border, I finally have something to anchor everything else to. While the initial work I did was great for getting the lay of the land generally, it wasn’t up to the standards I wanted. Going back to some of the same survey points, relying on the phone, I could see very obvious drifting (which makes sense with 4.5 m (14.75′) accuracy). This, of course, is not good enough.
So, what is one to do when you want an accurate survey, but don’t need it to be certified? Why, get your own survey equipment of course! For about a decade and a half, I’ve been interested in GIS technology. From contributing to OpenStreetMap occasionally to wondering if I could afford to buy a survey grade GPS through to trying to boot up my own OpenStreetMap based server, it’s always been a technology I’ve come back to. After some research, I discovered I needed two GPS receivers to be able to do RTK, and get the precision I was chasing. So, let’s go shopping for gear!

… On second thought, maybe I won’t.
After digging around for a while, and looking outside the professional market, I was lucky enough to find the help that SparkFun put together for exactly this purpose. Thanks to them, I was able to purchase everything I needed to get centimeter accuracy survey results, with a total spend of less than $2000, and build my base station in a box!
Achieving Centimeter Accuracy
Ok, so, to get to centimeter accuracy, you need two things:
- A GNSS mobile receiver (rover) that can receive both L1 and L2 signals, as well as receive and apply RTCM correction data.
- A source of RTCM correction data. There are many ways to do this, but the two most common are using a second receiver on a tripod over a known survey marker, or via NTRIP from a receiver at a permanent location (within 20 km / 12.4 mi is best).
Looking around, I found a Natural Resources Canada page that showed all available RTK servers that they know about, and searching that for my area, there was exactly one available that was roughly within the correct distance for correction data to be useful. Searching for the company that hosts this service led me to a page with a “Contact us” phone number, which usually means it’s going to be expensive, so I crossed that off my list, and decided to set up my own RTK NTRIP station.
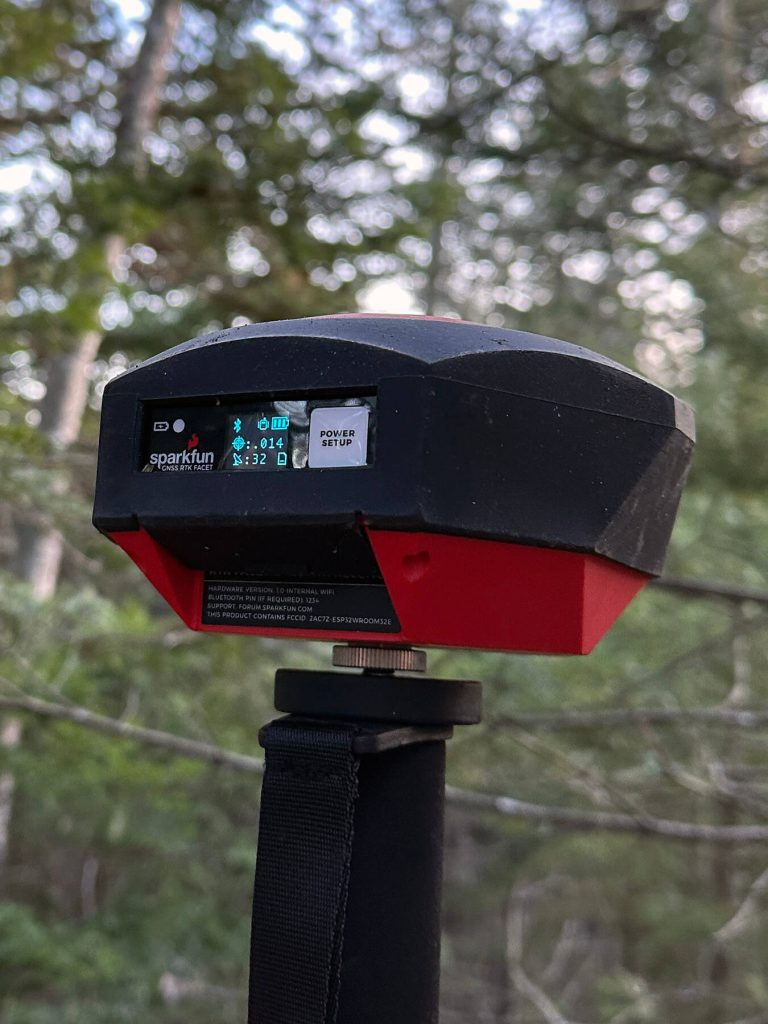
As for the rover, I took the easiest exit on that one, and purchased the SparkFun RTK Facet. Combined with a photography monopod and a few other bits, I have a working setup to walk around with. For data collection, I’m running SW Maps on my phone, which allows me to connect to the NTRIP data feed, and pass it through to the Facet. Since I’m on an iPhone, this seems to be the only low friction way to get all the data together in one place. (I’ve also loaded QField on my phone, since it’s the easiest way to work with the whole QGIS project I’ve put together if I want to reference something on the go, but it doesn’t support Bluetooth GNSS, and I didn’t want to tinker with getting a TCP stream working.)
| Item | Cost |
|---|---|
| SparkFun RTK Facet | $1,024.09 |
| |– FedEx Duties and Fees | $151.96 |
| 64-inch Camera Aluminum Monopod | $34.49 |
| 3/8 Inch Thread Tripod Spike, 6 Pack | $20.11 |
| Super Clamp Mount with Phone Mount | $20.19 |
| Total Cost | $1,250.84 |
Base Station In A Box
Now, the really fiddly part, the base station. I’m in the middle of rural land, luckily enough with LTE due to my land being high enough elevation to see the tower well. I have no buildings to mount to, and no permanent internet connection or power. Since it’s in the woods, I also have to be cognizant of having my gear stolen, exposed to the weather, or otherwise damaged. On top of all that, I want to keep my expenses as low as possible, since this is already an expensive project (still cheaper than buying or renting the gear though, in the long term).
Plunging in, I purchased the minimum parts I needed to get a station up and running, so I could figure out exactly what I needed to get a proper NTRIP server working. (SparkFun’s writeup was a very helpful reference in this project as well.)
| Item | Cost |
|---|---|
| SparkFun GPS-RTK-SMA Breakout – ZED-F9P (Qwiic) [$274.95 USD] GNSS Multi-Band L1/L2 Surveying Antenna – TNC (TOP106) [$133.95 USD] Reinforced Interface Cable – SMA Male to TNC Male (10m) [$29.95] | $678.80 |
| |– FedEx Duties and Fees | $100.77 |
| Total Cost | $779.57 |
Testing The Receiver
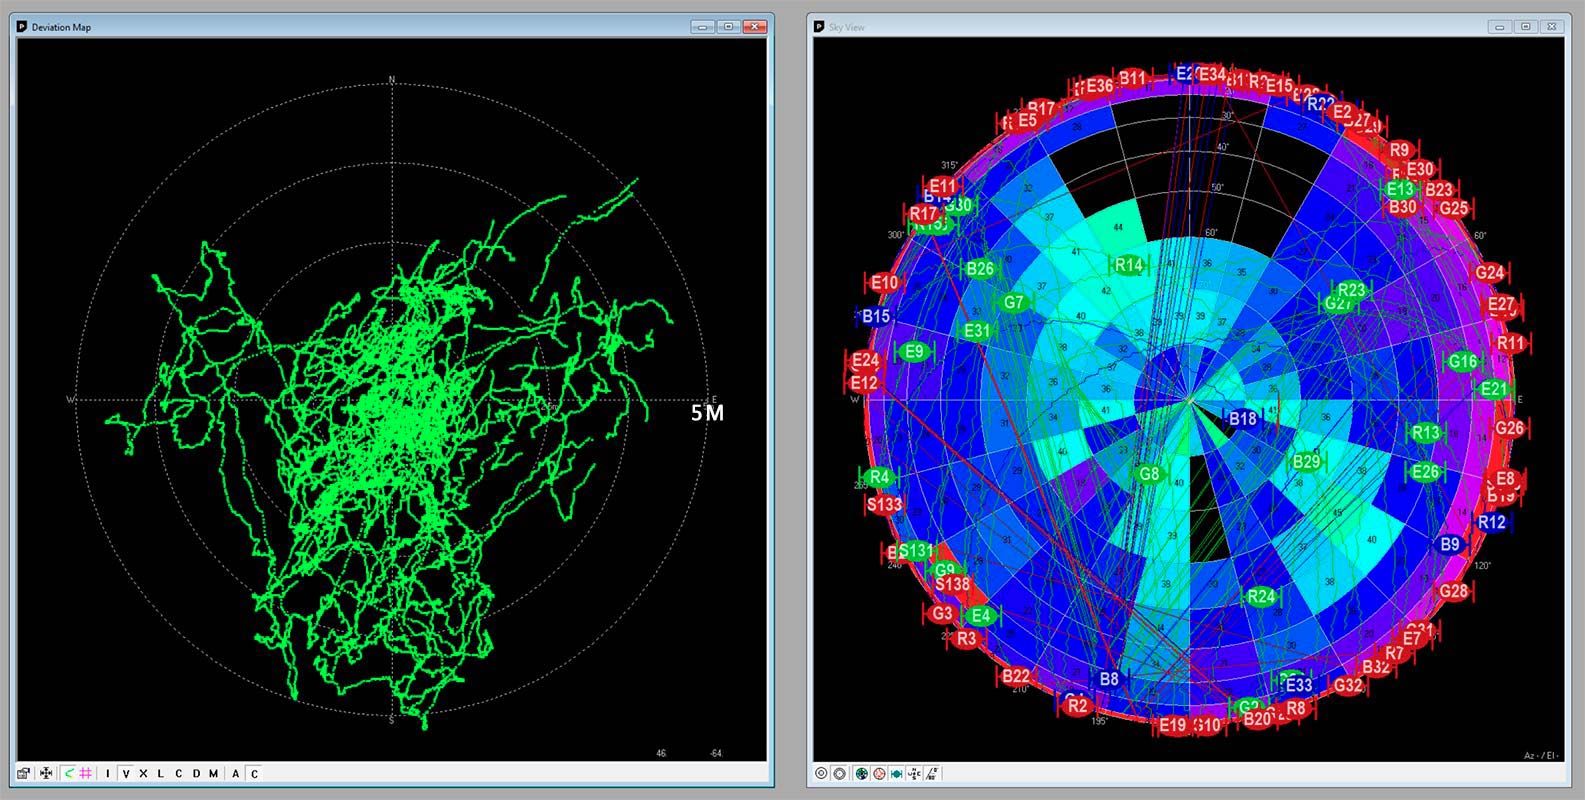
After eagerly waiting for a few days, I had a full fledge receiver in hand, and could get started. I quickly set up u-center on my laptop, followed the SparkFun tutorial to update the F9P firmware, and then back to their writeup about setting up the permanent base station. Going through the steps, I set up the antenna on a mic stand I had laying around, and placed it in the sunroom in my house (not the best way to site it, since it should be outside, but good enough to test with). With windows on three sides, it had a relatively good view of the sky, and overall position deviation in u-center stayed under 5 m (16′) for the most part.
Letting u-center run, I recorded close to 24 hours of data, and started testing with a copy of the UBX file I copied out after a few hours. My first runs I used RTKCONV from the RTKLIB project for conversation to RINEX format, but later I switched to Emlid Studio, which proved to be less fussy and a bit easier to work with. I ran into errors repeatedly when converting some files, where either RTKCONV would throw an unhelpful error, or the PPP processing service would not be happy with the file, and Emlid outputs have been consistently successful though this process.
The only thing I would suggest with the output files from Emlid would be to manually edit the antenna type header to contain your antenna information, as Emlid Studio currently doesn’t have a setting to enter this. To make this change, open your output file from Emlid (currently .23O extension) in Notepad or another text editor. Find the following line and replace it, then save the file.
# Find this line
                                                            ANT # / TYPE

# Replace with this line (this antenna is the one listed above, from SparkFun)
NONE                SFETOP106                               ANT # / TYPE
Calculating A Test Base Station Position
After tinkering with this, and collecting a day of data, it was time to compute an official position for my poorly sited antenna. Using the CSRS-PPP tool, I uploaded my RINEX file for processing (Epoch: 1997.0, Vertical datum: CGD2013). After a short wait, I received an email from the service with links to my calculated position.
| Measurement | Value | Deviation |
|---|---|---|
| Latitude | N46° XX’ XX.XXXX” | ± 0.032 m (1.3″) |
| Longitude | W64° XX’ XX.XXXX” | ± 0.030 m (1.2″) |
| Ellipsoidal Height | -6.XXX m | ± 0.145 m (5.7″) |
| Cartesian X | 1XXXXXX.XXX | ± 0.051 m (2.0″) |
| Cartesian Y | -4XXXXXX.XXX | ± 0.102 m (4.0″) |
| Cartesian Z | 4XXXXXX.XXX | ± 0.100 m (3.9″) |
Building The Base Station
Now that I have a confirmed workflow to get from scratch to a calculated position, it’s time to build a full base station. After some more research, the best low power solution I came up with is RTK Base, a lovely base station server package that will run on a Raspberry Pi, connect to the GPS unit, and can push data to an NTRIP server. As to the NTRIP service itself, I could either host it myself and mess with port forwarding and a bunch of other things, or use RTK2GO, a service that seems to be hosted by the makers of SNIP (thank you 🙏).
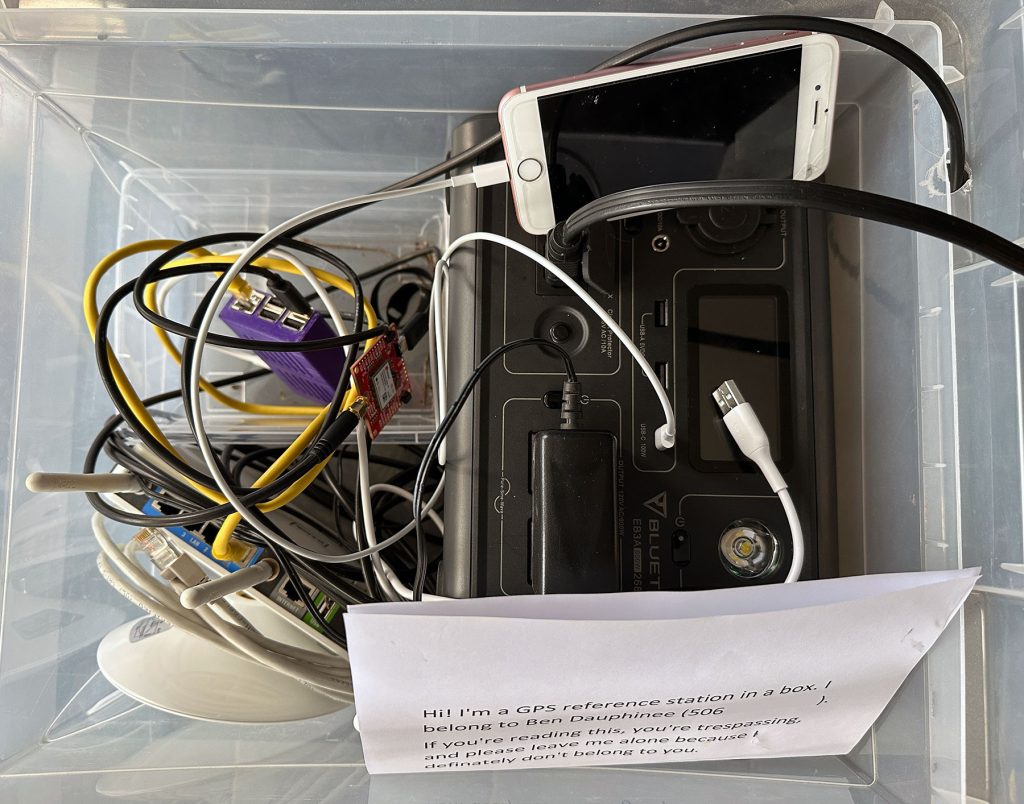
Scavenging through my various supplies, and evaluating costs, I decided to use RTK2GO, as the easiest thing to get up and running. This base station, plus the above receiver, fit in a mid-size plastic tote. I drilled a hole in the underside of the bin lip to route the antenna cable through, which means I can fully close the bin, and should keep any rain out of it. I’ve also put the power station in with the front panel facing up, to allow easy access to the charge ports, so I can just pop the lid open and plug it into wall power when I get home. All told, this package weighs approximately 7.7 kg (16.9 lb), and so is relatively easy to haul from my car to it’s site.
| Part | Description |
|---|---|
| Raspberry Pi 3 Model B+ | RTK Base server, to host the GPS unit and push data to the internet. |
| iPhone 6s | Provides data backhaul via hotspot mode. The Pi will connect automatically via Wi-Fi, since this is less fuss than tethering via USB. |
| Lucky Mobile Prepaid SIM /$30 Unlimited Can Min | Cheapest data service I can find without commitment. No setup fee, 1 GB of 3G data / month, which should give me plenty of run time for NTRIP. Edit [2024-01-02] Total data usage for 15-20 hours of surveying: 122 MB |
| BLUETTI EB3A (268Wh) Portable Power Station | LiFePO₄ chemistry, functional down to -20 C / -4 F (needed, since it’s Dec). Ran for 24 h data collection to complete antenna placement, only discharged to 45%. Bluetooth connected, so I can change power settings without opening the box. |
| D-Link DIR-655 Router | Provides field connectivity to Pi, via wired or wireless, when powered on. Allows me to check and configure RTK Base, as well as download data. Saved my bacon when my laptop battery died, as I could still access via Wi-Fi on my phone. |
| Network cables | One short one Pi <-> Router, one long one Laptop <-> Router. |
| USB cables | One micro-USB to power the PI, one Lightning to power the phone, both connected to Bluetti. |
| 2 L plastic bin | Helps segment the PI and GPS receiver, and keeps the power station from shifting around. |
| Note | I put a note in the box, in the hopes that maybe it’ll deter people from stealing things. Also has my phone number on it if they have questions. |
Establishing The Base Station
Now that I have all the parts tested and assembled, it’s time to properly site the station and get it dialed in. I have a fallen tree on my land, in the middle of a logged clearing. Going to the hardware store, I purchased a few nuts and some washers, and a 5/8-11 x 36-inch Fully Threaded Steel Rod. I also borrowed a nice 1″ installer drill bit from my father, then went for a drive.
Out at my land finally, after some quick work with the chainsaw to clear the deadfall around my chosen mount point, I started drilling. After a good twenty minutes with the slow speed high torque mode on my cordless drill (thank goodness for that, much easier to work with in the woods), I had a hole drilled through this rather significant tree trunk. A not so quick moment later (takes some time to move a nut down 2/3 of a rod), I had the mount point set up and relatively level, and antenna attached.
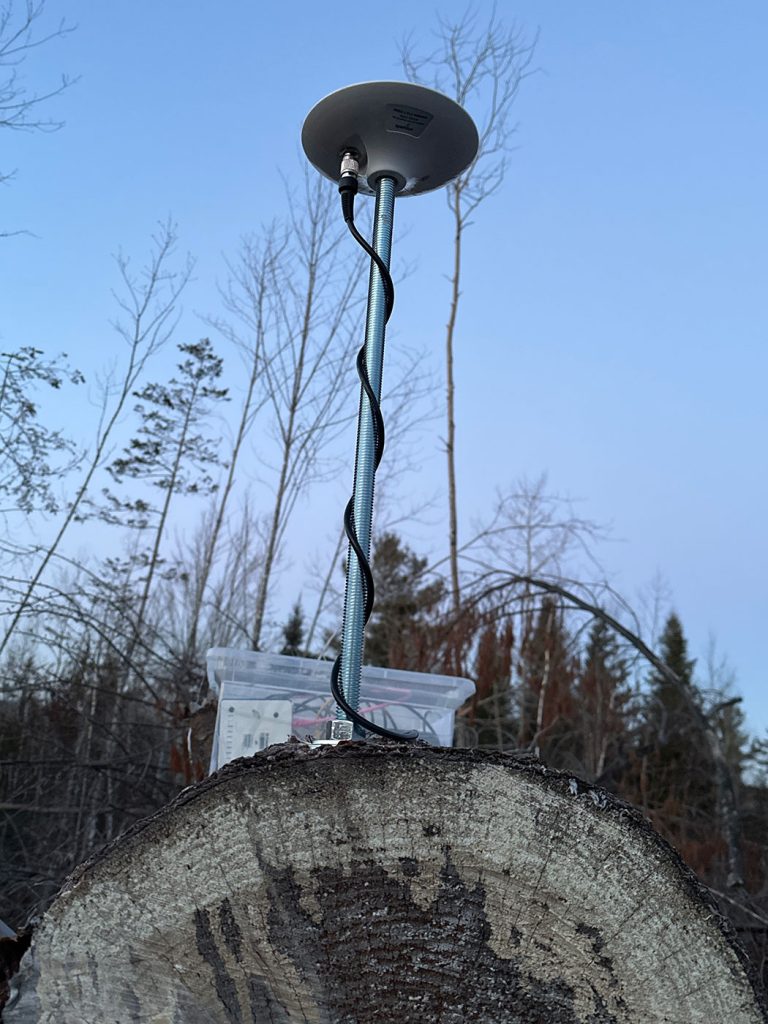
Booting up my laptop, I opened u-center, and checked how the visibility was (what a surprise, it was much better). A few minutes later, I had everything tucked into the box and hooked up, and checked in with RTK Base to make sure it was stable and (most important) that File mode was on, so it was actually recording data. Satisfied that everything was running smoothly, I finally tucked the box in under some brush, and went home for the night.
Coming back the next day, I spent some time clearing brush (one of my ongoing projects there), while I waited for the 24 hr mark. As soon as it was time, a quick login to RTK Base to pull its UBX file, shut it down and packed up the antenna. Before leaving, I loaded the UBX file into u-center, and replayed it to see how the data looked.
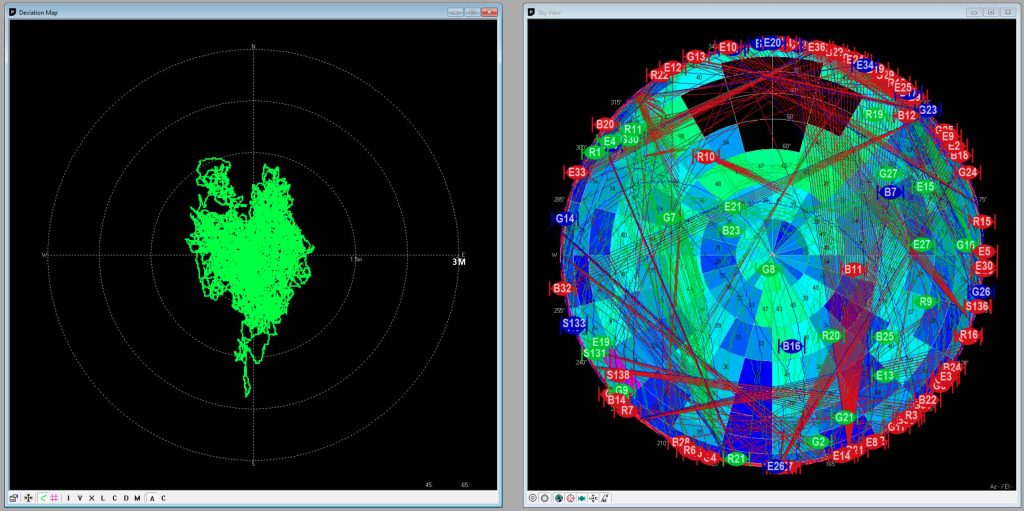
Fantastic! The data looked great, with a clear view of the sky, and a much tighter deviation map (most traces within 1m, compared to the previous run at home where it was 5m). After getting this data back home, I ran it through the CSRS-PPP service, and got my Rapid coordinates. This tool has 3 levels of location precision, Ultra-Rapid (60 minutes after the hour), Rapid (12 hours after the day), and Final (12 days after the week).
| Measurement | Value | Deviation |
|---|---|---|
| Latitude | N45° XX’ XX.XXXX” | ± 0.037 m (1.5″) |
| Longitude | W65° XX’ XX.XXXX” | ± 0.027 m (1.1″) |
| Ellipsoidal Height | -6.XXX m | ± 0.023 m (0.9″) |
| Cartesian X | 18XXXXX.XXX | ± 0.037 m (1.5″) |
| Cartesian Y | -40XXXXX.XXX | ± 0.027 m (1.1″) |
| Cartesian Z | 45XXXXX.XXX | ± 0.022 m (0.9″) |
Compared to my previous results, the deviations on this location are much lower (and I expect they’ll be a little closer after I can get Final position). With these coordinates, I updated the RTK Base config, so it knew where it’s antenna was.
Surveying
Now that I have a solution on antenna location, I can start the work. Going back out the next day, I set up my base station, and started roaming. First, I spent some time surveying known markers to establish accuracy. I located both my own property markers (since I had just had a survey done telling me exactly where they were), as well as some nearby government markers (many provinces have a list of survey monuments, including New Brunswick).
To know where to look for these monuments, I created a CSV of all the monument coordinates I wanted to verify with, loaded it into QGIS, and then exported it to a GeoPackage format file. Taking that file, I copied it into my iPhone, in the SW Maps/Layers/geopackage folder (at the time of writing, there seems to be a bug with GeoJSON and shapefile rendering, which I’ve informed the app author of).
In SW Maps, I then imported this file, which created a new layer in my project that I could reference. To get the coordinates for the points, I used the NB Coordinate Transformation Service (CTS), which allows me to flip them from Cartesian / Stereographic Double (Northing, Easting) to Geographic (Lat, Long).
NAME,GEOMETRY
2XXXX,POINT Z (-65.XXXXXXXXX 45.XXXXXXXXX)
1XXXX,POINT Z (-65.XXXXXXXXX 45.XXXXXXXXX)
1XXXX,POINT Z (-65.XXXXXXXXX 45.XXXXXXXXX)
"NORTH PROPERTY MARKER",POINT Z (-65.XXXXXXXXX 45.XXXXXXXXX)
"SOUTH PROPERTY MARKER",POINT Z (-65.XXXXXXXXX 45.XXXXXXXXX)
After driving over half the county chasing these monuments (the above is a truncated CSV sample), I was relatively confident in my setup (worst measurement was 32 mm [1.26 in] off from center, best was 3 mm [0.12 in]). I spent the rest of my afternoon walking the land, and collected over 400 data points.
Taking the data back home to QGIS, I exported it to CSV from SW Maps, and imported it in, and started to look at what I had collected. And then I realized that something was wrong.
Correcting The Data
After all this work, I had an error. Latitude and longitude appeared to be correct, but what I hadn’t validated on those monuments was … elevation. Starting to poke at the data, and comparing it to the elevation contours from the GeoNB maps, I realized I was off by at least 7 m (23 ft), if not more. After a round of research, I realized two things: there’s a ellipsoid elevation and an orthometric elevation (mean sea level), and thank goodness SW Maps records both. Here’s a sample of their export file:
ID,Remarks,Time,Geometry,Latitude,Longitude,Elevation,Ortho Height,Instrument Ht,Fix ID,Horizontal Accuracy,Vertical Accuracy
3,Driveway Right Edge,24-12-2023 16:00:00.000 -0400,POINTZ(-65.XXXXXXXXX 45.XXXXXXXXX 78.XXXX),45.XXXXXXXXX,-65.XXXXXXXXX,78.XXXX,103.XXXX,1.73,4,0.01,0.01
4,Driveway Left Edge,24-12-2023 16:00:00.000 -0400,POINTZ(-65.XXXXXXXXX 45.XXXXXXXXX 78.XXXX),45.XXXXXXXXX,-65.XXXXXXXXX,78.XXXX,103.XXXX,1.73,4,0.01,0.01
I also found a tool in the Natural Resources toolbox called GPS·H, which allows you to transform from one height system to another, based on coordinates and time. After looking at the data I had recorded from the official survey monuments, I worked out that my elevations were correct, but that the ortho heights were what was wrong (and ran my file through their batch processing to get corrected elevations).
I also learned there are geoid models that can properly convert from ellipsoid to orthometric elevations (also provided by Natural Resources). Downloading the model file I needed (the BYN for CGG2013a), I ran it through a converter to get it into GTX format. Finally, I loaded it into my phone (SW Maps/Geoid), and set it in the app settings as the model to use.
Going out the next day, armed with this new information, I once again ran a survey of my known control points, and also manufactured a few temporary monuments on my property (using some flagging tape, stumps, and Phillips head screws as a forced centering mark) to use as control points for my further data collection.
With that done, I surveyed a few hundred more data points, and once again returned home to verify everything. Thankfully, this time, the exported data had what appeared to be correct orthometric heights, and now I could get on to generating my own topographical maps.
Finally, The Mapping
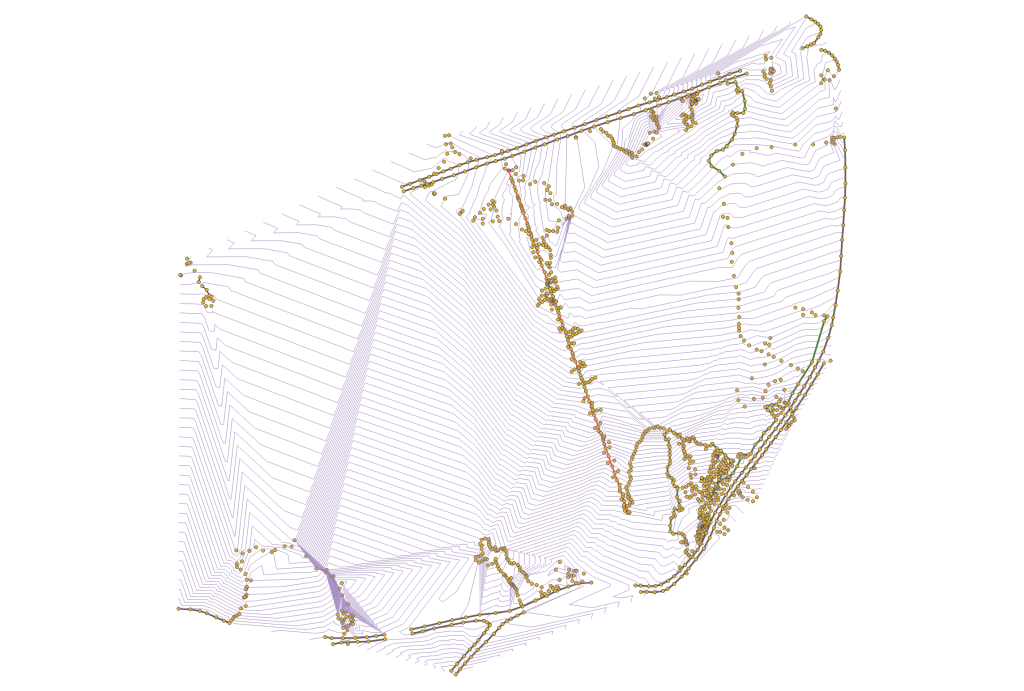
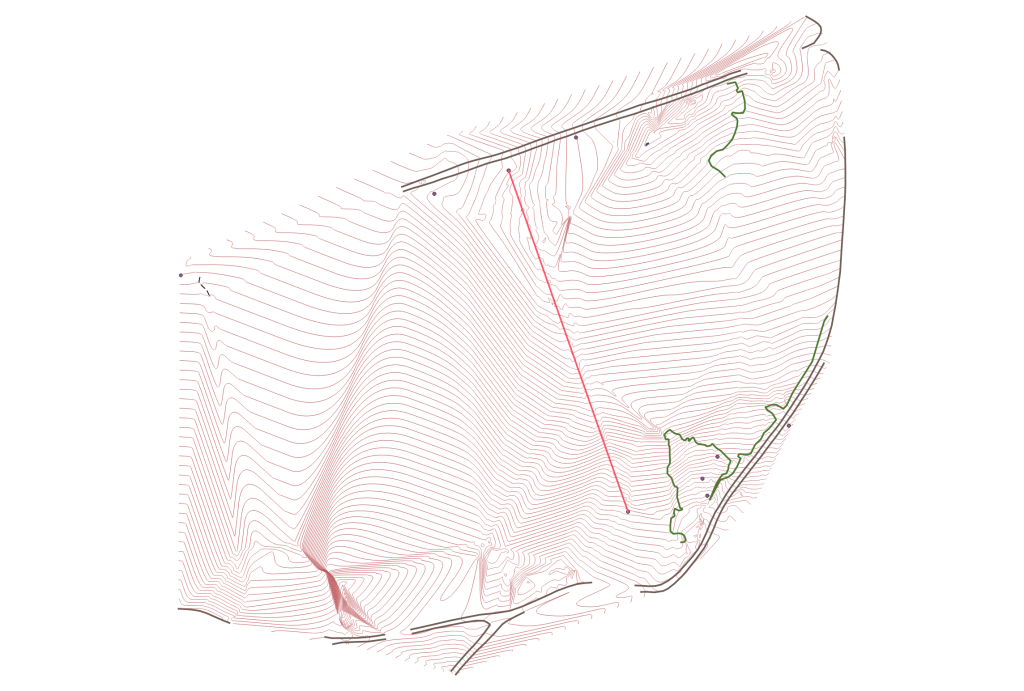
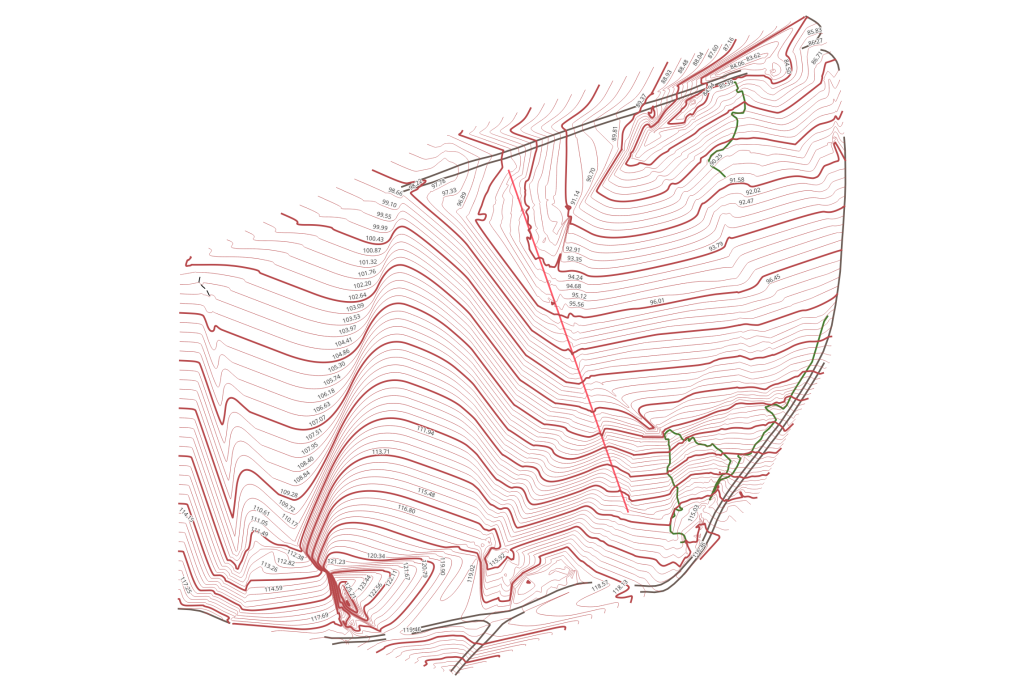
Now that I have all the data, it’s map time! Over 1400 data points collected in three days, I now have enough data to start plotting features like roads and tree lines, and I can start to see the shape of the land. With help from these tutorials, I was able to process my point data into a useful contour map. The images you see below are at 100 interval density, but I’ve generated higher densities so I can look closely at the spots where I’ve collected a lot of data points. You can see each step from raw data to smooth labeled contours. For my bold lines, I used an expression that highlights every 5th line, instead of specific altitudes.
Final Words
Obviously, I still have a lot of data I need to fill in, and there are some water features, clearings, and other elements I need to survey. However, after a few weeks of experimenting with QGIS, and a few days of boots on the ground surveying with the SparkFun Facet, I’m quite happy being able to start to properly see how my land looks. I have requested the survey company I use to come back, and give me proper validated elevations and locations for all the monuments I’m using as control, so I can be more confident in my measurements.
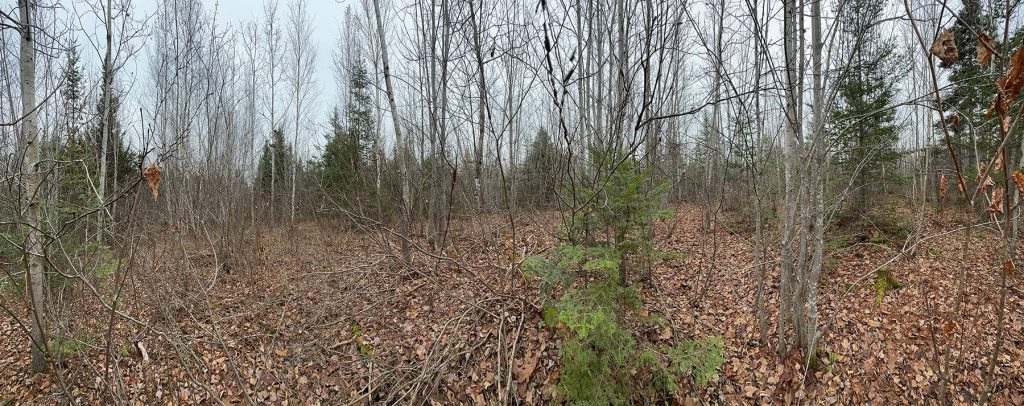
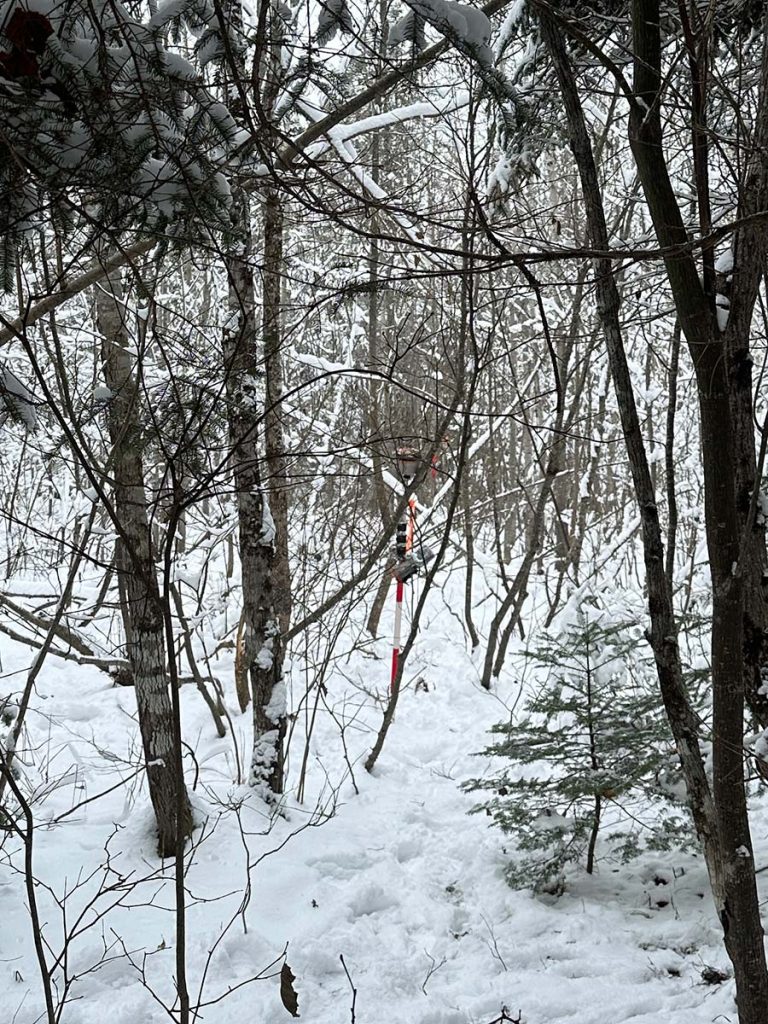
One of the things I was impressed by was the Facet’s ability to hold an RTK Fix, even under somewhat dense canopy. The photo to the left was taken in a thicket of evergreen trees, where the receiver still managed to hold its fix. I did notice that it wobbled a lot more between RTK Fix and RTK Float as I got into the steeper hills on my land, or into the really thick forest, but overall, its performance was better than I hoped while being in the deep woods.
I’m also very happy I’m not running this survey in the summer, because I know I’d lose my cell signal for the correction data in the middle of my land, where the leaves and trees have blocked it out before.
From where I started, to now at the end of this post, I hadn’t realized I had done so much learning in so short a period of time. I know I’m only scratching the surface, and I did not expect to have so much to write about when I started this. I hope my experiences are helpful to some of you, and I can’t wait to see what else I learn as I build up this dataset.
Cheers!
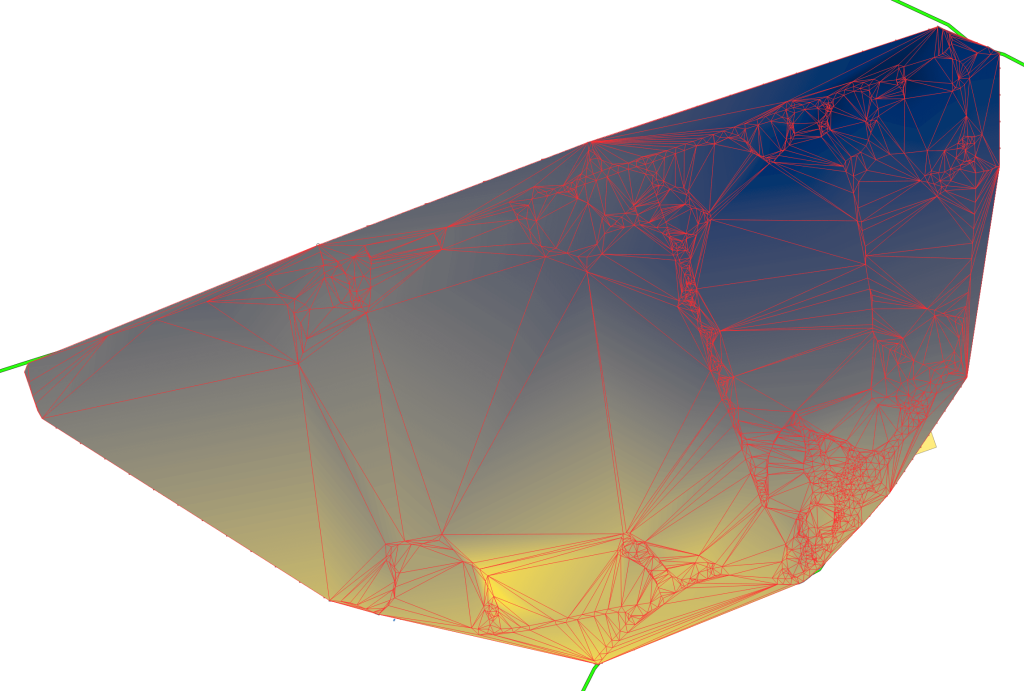
EDIT [2024-01-01]: Hacker News Discussion, and a Triangulated Irregular Network (TIN) mesh illustration. It doesn’t exactly match the above images, as I’ve added additional survey points, but should give you an idea of how the data starts being interpreted into contours.
EDIT [2024-01-12]: This was also featured on HackADay!
EDIT [2024-01-18]: And also featured on SparkFun’s blog!
Leave a Reply